What Seed Funding Bubble?

At the moment, people seem to believe there’s a “bubble” in seed-stage technology funding.  Many limited partner investors in VC funds I’ve spoken with have raised the concern and related topics seem popular on Quora (see here, here, and here).  However, I’ve examined the data and it argues pretty strongly against a widespread seed-stage bubble.

Rather, I think the increased attention that top startups attract these days induces availability bias.  Because Y Combinator and superangels generate pretty intense media coverage, people read more frequently about the few big investments in seed-stage startups.  They confuse the true frequency of high valuations with the amount of coverage.  Of course, they never read about all the other seed-stage startups that don’t get high valuations.

But if you look at the data on the aggregate amount of seed funding and the average deal size, I think it’s very hard to argue for a general seed-stage bubble.  At worst, there may be a very localized bubble centered around consumer Internet startups based in the Bay Area.

First, look at the amount of seed funding by angels over the last nine years, as reported by the Center for Venture Research.  I calculated the amount for each year by multiplying the reported total amount of funding by the reported percentage going to seed and early stage deals.  (Note: for some reason the CVR didn’t report the percentage in 2004, so I interpolated that data).

As you can see, the amount of seed funding by angels in 2009-20010 was down by half from its level in 2004-2006.  Hard to have a bubble when you’re only investing 50% of the dollars you were at the recent peak.  But perhaps it’s a pricing issue and angels are pumping more dollars into each startup.  While the CVR doesn’t break down the average investment amount at each stage, we can calculate the average investment amount across all stages and use it as a rough index for what is probably going on at the seed and early stage (the index of 100 corresponds to a $436K investment).

The amount invested in each startup in 2010 was down 35% from its 2006 peak.  Now, the investment amount is not the same as the valuation.  However, for a variety of reasons (anchoring on historical ownership, capitalization table management, and price  equilibrium for the marginal startup), I doubt angels have radically changed the percentage of a company they try to own.  So deal size shifts should be a good proxy for valuation shifts.

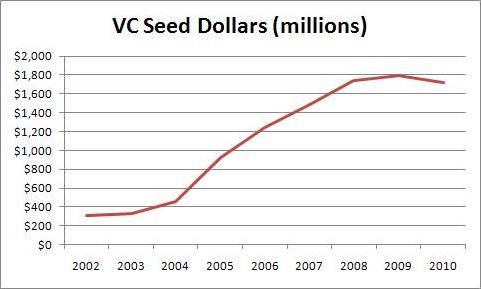
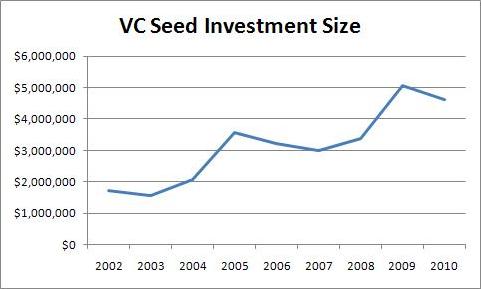
Now, you might think that VC moves in the seed stage market could be a factor.  Probably not, for two reasons.  First, VCs account for a much smaller share of the seed stage market.  Second, what gets counted as the seed stage in the VC data isn’t what most of us think of as seed stage investments.  Check out the seed dollar chart and the average seed investment data from the National Venture Capital Association.

Notice that amount of seed funding by VCs has remained flat for the last three years.  Moreover, angels invest dollars in the seed stage at a rate of 3:1 compared to VCs.  So VCs probably aren’t contributing to a widespread seed bubble.  But the story takes a strange twist if you look at the average size of VCs’ seed stage investments.

The size has increased since 2007.  But look at the absolute level!  $4M+ seed rounds?  I’m starting to think that “seed” does not mean the same thing to VCs as it does to angels and entrepreneurs.  Obviously, VCs cannot be affecting what I think of as the seed round very much.  However, they could be generating the impression of a bubble by enabling a few “mega-seed” deals.  VCs did 373 seed deals in 2010 while angels did around 20,000 (NVCA and CVR data, respectively).

The last factor we have to account for is the superangels.  Most of them are not members of the NVCA.  However, they probably aren’t counted by the CVR surveys of individual angels and angel groups either.  ChubbyBrain has a list of the superangels that seems pretty complete; I can’t think of anyone I consider a superangel who isn’t on it.  Of the 16, there are known fund sizes for 13.  Two of them (Felcis and and SoftTech VC) are members of the NVCA and thus included in that data.  The remaining 11 total $253M.

Now, there are probably some smaller, lesser known superangels not on this list.  However, many on the list will not invest all their dollars in a single year and some will invest dollars in follow-on rounds past the seed stage.  So I’m confident that $253M is a generous estimate of the superangel dollars that go into the seed stage each year.  That’s only about 3% of angels and VCs combined.

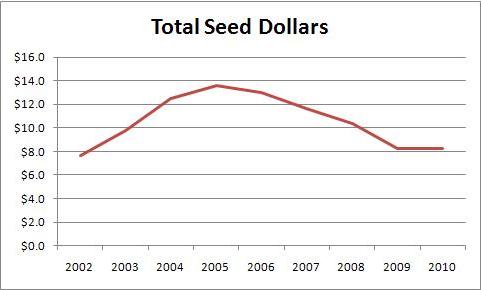
Just to really drive the point home, here’s a graph of all seed dollars, assuming superangels did $253M per year in 2009 and 2010.  Seed funding is down $5.4B or 40% from it’s peak in 2005! So I don’t believe there’s a bubble.

(The spreadsheet with all my data is here.)

More Angel Investing Returns

According to our Web statistics, my post on Angel Investing Returns was pretty popular, so I thought I’d dive a little deeper into the process of extracting information from this data set.  At the end of the last post, I hinted that there might be some value in, “…analyzing subsets of the AIPP data…”  Why would you want to do this?  To test hypotheses about angel investing.

Now, you must be careful here.  You should always construct your hypotheses before looking at the data.  Otherwise, it’s hard to know if this particular data is confirming your hypothesis or if you molded your hypothesis to fit this particular data.  You already have the challenge of assuming that past results will predict future results.  Don’t add to this burden by opening yourself to charges of “data mining”.

I can go ahead and play with this data all I want.  I already used it to “backtest” RSCM‘s investment strategy.  We developed it by reading research papers, analyzing other data sources, and running investment simulations.  When we found the AIPP download page, it was like Christmas: a chance to test our model against new data.  So I already took my shot.  But if you’re thinking about using the AIPP data in a serious way, you might want to stop reading unless you’ve written your hypotheses down already.  As they say, “Spoiler alert.”

But if you’re just curious, you might find my three example hypothesis tests interesting.  They’re all based loosely on questions that arose while doing research for RSCM.

Hypothesis 1: Follow On Investments Don’t Improve Returns

It’s an article of faith in the angel and VC community that you should “double down on your winners” by making follow on investments in companies that are doing well.  However, basic portfolio and game theory made me skeptical.  If early stage companies are riskier, they should have higher returns.  Investing in later stages just mixes higher returns with lower returns, reducing the average.  Now, some people think they have inside information that allows them to make better follow-on decisions and outperform the later stage average.  Of course, other investors know this too.  So if you follow on in some companies but not others, they will take it as a signal that the others are losers.  I don’t think an active angel investor could sustain much of an advantage for long.

But let’s see what the AIPP data says.  I took the Excel file from my last post and simply blanked out all the records with any follow on investment entries.  The resulting file with 330 records is here.  The IRR was 62%, the payout multiple was 3.2x, and the hold time was 3.4 years.  That’s a huge edge over 30% and 2.4x!

Now, let’s not get too excited here.  There’s a difference between deals where there was no follow on and deals where an investor was using a no-follow-on strategy.  We don’t know why an AIPP deal didn’t have any follow on.  It could be that the company was so successful it didn’t need more money.  Of course, the fact that this screen still yields 330 out of 452 records argues somewhat against a very specific sample bias, but there could easily be more subtle issues.

Given the magnitude of the difference, I do think we can safely say that the conventional wisdom doesn’t hold up.  You don’t need to do follow on. However, without data on investor strategies, there’s still some room for interpretation on whether a no-follow-on strategy actually improves returns.

Hypothesis 2: Small Investments Have Better Returns than Large Ones

Another common VC mantra is that you should “put a lot of money to work” in each investment.  To me, this strategy seems more like a way to reduce transaction costs than improve outcomes, which is fine, but the distinction is important.  Smaller investments probably occur earlier so they should be higher risk and thus higher return.  Also, if everyone is trying to get into the larger deals,  smaller investments may be less competitive and thus offer greater returns.

I chose $300K as the dividing line between small and large investments, primarily because that was our  original forecast of average investment for RSCM (BTW, we have revised this estimate downward based on recent trends in startup costs and valuations).  The Excel file with 399 records of “small” investments is here.  The IRR was 39% and the payout multiple was 4.0x.  Again, a huge edge over the entire sample!  Interestingly, less of an edge in IRR but more of an edge in multiple than the no-follow-on test.  But smaller investments may take longer to pay out if they are also earlier.  IRR really penalizes hold time.

Interesting side note.  When I backtested the RSCM strategy, I keyed on investment “stage” as the indicator of risky early investments.  Seeing as how this was the stated definition of “stage”, I thought I was safe.  Unfortunately, it turned out that almost 60% of the records had no entry for “stage”.  Also, many of the records that did have entries were  strange.  A set of 2002 “seed” investments in one software company for over $2.5M?  A 2003 “late growth” investment in a software company of only $50K?  My guess is that the definition wasn’t clear enough to investors filling out the survey.  But I had committed to my hypothesis already and went ahead with the backtest as specified.  Oh well, live and learn.

Hypothesis 3: Post-Crash Returns Are No Different than Pre-Crash Returns

As you probably remember, there was a bit of a bubble in technology startups that popped at the beginning of 2001. You might think this bubble would make angel investments from 2001 on worse.  However, my guess was that returns wouldn’t break that cleanly.  Sure, many 1998 and some 1999 investments might have done very well.  But other 1999 and most 2000 investments probably got caught in the crash.  Conversely, if you invested in 2001 and 2002 when everybody else was hunkered down, you could have picked up some real bargains.

The Excel file with 168 records of investments from 2001 and later is here.  23% IRR and 1.7x payout multiple.  Ouch!  Was I finally wrong?  Maybe.  Maybe not.  The first problem is that there are only 168 records.  The sample may be too small.  But I think the real issue is that  the dataset “cut off” many of the successful post-bubble investments because it ends in 2007.

To test this explanation, I examined the original AIPP data file.  I filtered it to include only investment records that had an investment date and where time didn’t run backwards.  That file is here.  It contains 304 records of investments before 2001 and 344 records of investments in 2001 or later.  My sample of exited investments contains 284 records from before 2001 and 168 records from 2001 or later.  So 93% of the earlier investments have corresponding exit records and 49% of the later ones do.  Note that the AIPP data includes bankruptcies as exits.

So I think we have an explanation.  About half of the later investments hadn’t run their course yet.  Because successes take longer than failures, this sample over-represents failures.  I wish I had thought of that before I ran the test!  But it would be disingenuous not to publish the results now.

Conclusion

So I think we’ve answered some interesting questions about angel investing.  More important, the process demonstrates why we need to collect much more data in this area.  According to the Center for Venture Research, there are about 50K angel investments per year in the US.  The AIPP data set has under 500 exited investments covering a decades long span.  We could do much more hypothesis testing, with several iterations of refinements, if we had a larger sample.

analyzing subsets of the AIPP dataneed

Angel Investing Returns

In my work for RSCM, one of the key questions is, “What is the return of angel investing?”  There’s some general survey data and a couple of angel groups publish their returns, but the only fine-grained public dataset I’ve seen comes from Rob Wiltbank of Willamette University and the Kauffman Foundation’s Angel Investor Performance Project (AIPP).

In this paper, Wiltbank and Boeker calculate the internal rate of return (IRR) of AIPP investments as 27%, using the average payoff of 2.6x and the average hold time of 3.5 years.  Now, the arithmetic is clearly wrong: 1.27^3.5 = 2.3.  The correctly calculated IRR using this methodology is 31%. DeGenarro et al report (page 10) that this discrepancy is due to the fact that Wiltbank and Boeker did not weight investments appropriately.

In any case, the entire methodology of using average payoffs and hold times is somewhat iffy.  When I read the paper, I immediately had flashbacks to my first engineering-economics class at Stanford.  There was a mind-numbing problem set that beat into our skulls the fact that IRR calculations are extremely sensitive to the timing of cash outflows and inflows.  I eventually got a Master’s degree in that department, so loyally adopted IRR sensitivity as a pet peeve.

To calculate the IRR for the AIPP dataset, what we really want is to account for the year of every outflow and inflow.   The first step is to get a clean dataset.  I started by downloading the public AIPP data.  I then followed a three step cleansing process:

  1. Select only those records that correspond to an exited investment.
  2. Delete all records that do not have both dates and amounts for the investment and the exit.
  3. Delete all records where time runs backwards (e.g., payout before investment).

The result was 452 records.  A good-sized sample.  The next step was to normalize all investments so they started in the year 2000.  While not strictly necessary, it greatly simplified the mechanics of collating outflows and inflows by year.  Finally, I had to interpolate dates in two types of cases:

  1. While the dataset includes the years of the first and second follow on investment, it does not include the year for the “followxinvest”. For the affected 12 records, I interpolated by calculating the halfway point between the previous investment and the exit, rounding down.  Note that this is a conservative assumption.  Rounding down pushes the outflow associated with the investment earlier, which lowers the IRR.
  2. For 78 records, there are “midcash” entries where investors received some payout before the final exit.  Unfortunately, there is no year associated with this payout.  A conservative assumption pushes inflows later, so I assumed that the intermediate payout occurred either 0, 1, or 2 years before the final exit.  I calculated the midpoint between the last investment and the final exit and rounded down.  If it was more than 2 years before the final exit, I used 2 years.

With these steps completed, I simply added up outflows and inflows for every year and used the Excel IRR calculation.

The result was an IRR of 30% and a payoff multiple of 2.4x with an average hold time of 3.6 years.

Please note that this multiple is slightly lower than the 2.6x and the hold time is slightly higher than the 3.5 years Wiltbank and Boeker calculated for the entire dataset.  Thus, my results do not depend on accidentally cherry-picking high-returning, quick-payout investments.  If you want to double-check my work, you can download the Excel file here.

All in all, a satisfying result.  Not too different from what’s other people have published, but I feel much more confident in the number.  For anyone analyzing subsets of the AIPP data, I’ve found that my Excel file makes it pretty easy to calculate those returns.  Just zero out all records you don’t care about by selecting the row and hitting the “Delete” key.  The return results will update correctly.  But don’t do a “Delete Row”.  Then a bunch of the cell references will be broken.  [Update 1/27/11: I’ve done a follow up post on using this method to test various hypotheses.]

You Can’t Pick Winners at the Seed Stage

[EDITED 05/08/2009: see here] The majority of people I’ve talked to like the idea of revolutionizing angel funding. Among the skeptical minority, there are several common objections. Perhaps the weakest is that individual angels can pick winners at the seed stage.

Now, those who make this objection usually don’t state it that bluntly. They might say that investors need technical expertise to evaluate the feasibility of a technology, or industry expertise to evaluate the likelihood of demand materializing, or business expertise to evaluate the evaluate the plausibility of the revenue model. But whatever the detailed form of the assertion, it is predicated upon angels possessing specialized knowledge that allows them to reliably predict the future success of seed-stage companies in which they invest.

It should be no surprise to readers that I find this assertion hard to defend. Given the difficulty in principle of predicting the future state of a complex system given its initial state, one should produce very strong evidence to make such a claim and I haven’t seen any from proponents of angels’ abilities. Moreover, the general evidence of human’s ability to predict these sorts of outcomes makes it unlikely for a person to have a significant degree of forecasting skill in this area.

Continue reading