How Many Angel Investments?

As regular readers know, I’m a huge fan of the AIPP data set collected by Rob Wiltbank.  In this TechCrunch article from a while back, Rob corrected the mistaken assertion that angels don’t make money.  He also said that, “Angel investors probably should look to make at least a dozen investments…” While this statement isn’t wrong, neither is it as nuanced as I would like.

In this previous post, I used simulated data to examine the issue of adequate diversification. As it happens, I’ve also privately analyzed this issue using Rob’s AIPP data, an analysis I will now make public. [Hat tip to Paul P, a colleague with a professional financial statistics background who inspired and reviewed the original analysis, though any mistakes remain mine.]

To achieve my fully nuanced answer, I need to address two issues. But I’ll devote separate posts to each issue.  This post addresses the issue that diversification is a tradeoff.  More diversification will always protect you slightly more from idiosyncratic risk, all other things being equal (see my diversification posts one and two). But diversification isn’t free. It’s harder to make 10 investments than 1, and harder still to make 100. As an investor, you want to know how much each additional investment reduces idiosyncratic risk so you can make the right tradeoff for you.

To demonstrate this tradeoff, I’ll focus on RSCM‘s particular investing strategy: seed stage, no follow on, technology sector.  I documented how I applied this strategy to the AIPP data set, complete with filtered data file, in this post. In principle, you could create a filtered data file for your own strategy as described in this other post and then apply the procedure below to calculate the precise diversification tradeoff for your strategy.

The key to the whole problem is a statistical technique called resampling; I’ll take the records from my filtered data file and create 10K portfolios for a variety of portfolio sizes, using random sampling with replacement. Then it’s straightforward to determine how much the historical returns at each portfolio size could vary. Essentially, we’re performing the following thought experiment: what if 10K angels randomly invested in the startups that Rob studied?  What if they each invested in 10, 20, 30,… companies?  How likely would a given angel have been to achieve a given return?

The return for the entire sample is a 42% IRR and a 3.7x payout multiple.  The graph below shows the probability of achieving at least 1x, 2x, and 3x the original investment for a range of portfolio sizes. [Excel file with data, sampling macro, and probability macro is here.]

aippstrateresampling2

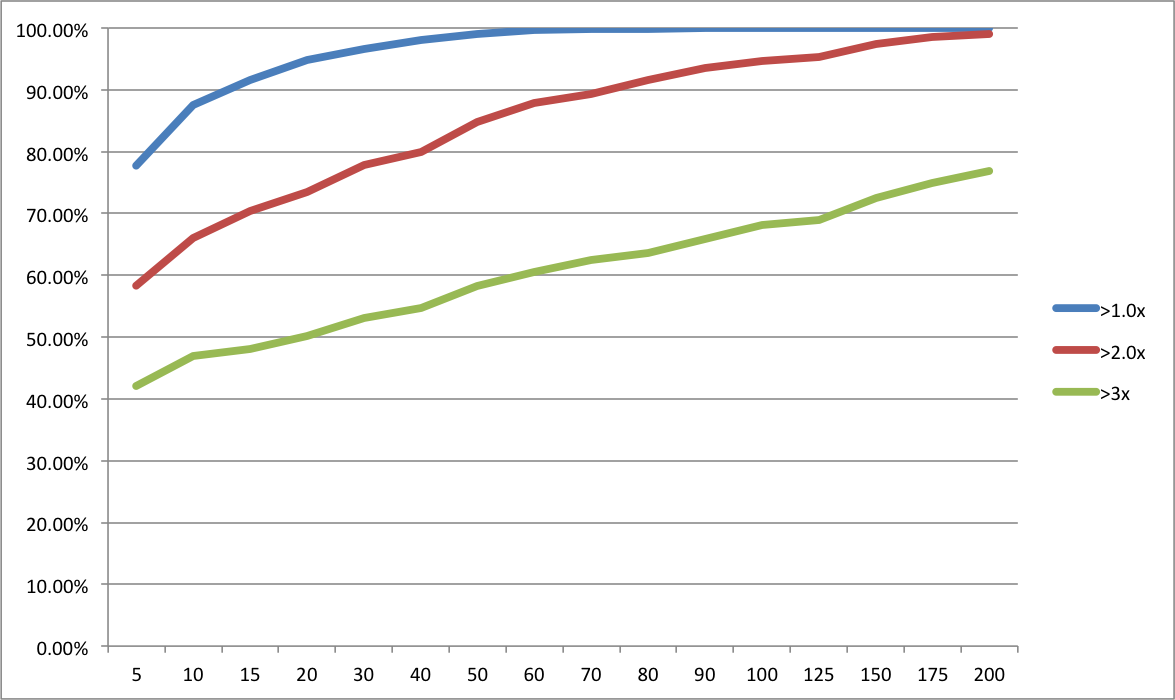
Now you can see the diversification tradeoff.  Personally, I think a bare minimum is a 90% chance of getting at least your money back. That’s 15 investments based on the historical data. Roughly the same as Rob’s answer of a “dozen”. But I’d really prefer a 90% chance of doubling my money. That’s 70 investments. Now, if I’m managing other people’s money, I’d really like to push to an 80% chance of tripling their money, which is over 200 investments. I didn’t run 400 investments, but I’m guessing that is roughly the point at which you would have had a 90% chance of tripling other people’s money. [Update 4/2/2013: after doing a bunch or runs, it looks like it takes over 500 investments to achieve a 90% chance of tripling.] As far as I know, 500 Startups is the only firm other than RSCM that is even shooting for that level of diversification in a single portfolio.

So there’s my take on the first issue, diversification as a tradeoff. The second issue is essentially the old problem of, “Past performance is no guarantee of future results.” What if the return distribution of seed stage technology startups is different going forward than during the period Rob collected data? It turns out there’s a nifty way to use resampling to test the sensitivity of different levels of diversification to shifts in the return curve. That’s the topic of the next post.

[Updated 4/25/2013: corrected minor error in spreadsheet and graph]

Seed Bubble Watch 1st Half 2012

Yes, it’s time for another edition of “Seed Bubble Watch”.  The subtitle for this round is, “Still Waiting to Inflate.”

For notes on sources and methods, see my previous posts in the series here, here, and here.  Current spreadsheet is here. Now to the money charts:

The first chart shows a slight dip back towards 2009 and 2010 levels.  However, I think this is an artifact of seasonality in angel investing.  Comparing 1H2012 to 1H2011 for the angel data, there’s actually an increase of 7% from a $6.9B annual rate to a $7.4B annual rate.  It’s just that 2H2011 had a $12.1B annual rate.  I know of nothing specific that happened in the second half of last year to account for a spike, so my guess is that angel activity is just generally higher July through December.  My prediction is that when the full year 2012 numbers come out in April 2013, we’ll see 2012 angel investing at slightly over $10B.

Reported VC seed stage investing continues to drop (with my standard caveat that what VC’s call “seed” is probably different from angels).  But it was made up for by increases in the size of super angel funds. The obvious explanation is that super angels are taking over part of the VC seed function. I think there’s more to it than that, but substitution and specialization are certainly part of the story.

Recall that I aggressively assume super angels deploy all their dollars in one year, to make my synthesized investment metric maximally sensitive to detecting bubbles.  It looks like this assumption may not be too far out of line with reality.  Aydin Senkut’s Felicis Ventures is raising a $71M fund after a $40M fund in 2010.  Mike Maples’ Floodgate is raising $75M after $70M in 2010.   Lerer Ventures is raising $30M after $25M in 2011. Ron Conway’s SV Angel is raising $40M after $28M in 2011.  Chris Sacca’s Lowercase Capital is raising $65M after $28M in 2010. And finally, our big winner is Thrive Capital, raising $150M ($147M of which was already in the door as of 9/6/2012) after $40M in 2011. Given IA Ventures‘ big raise noted in our last installment, we’ve got two NYC new media funds blowing up. And it seems like a lot of the leading funds are on a 1-2 year cycle.

I think this data supports my previous assertions that there is no general seed bubble in the US.  However, it certainly seems plausible that Silicon Valley and NYC could have local bubbles given the increasing dollars going into super angel funds in those areas and anecdotal reports of high valuations.  But my ad hoc conversations with people at the super angels indicate they are investing in a wide variety of locations. It’s possible that, at the margin, angels and super angels are choosing to invest outside of Silicon Valley and NYC often enough that we’ve reached an equilibrium.

For the rest of 2012 and all of 2013, I think the big driver will be the overall economy. GDP growth was only 1.3% in the 2nd quarter and 2.0% in the 1st quarter. The 20-year average is 2.5%.  So I don’t expect a big increase in seed funding until we at least get above that rate.

Valuing Seed Stage Startups

One of the questions I most frequently answer about RSCM is how we value seed stage startups. Apparently, being not only willing, but eager to set equity valuations sets us apart from the vast majority of investors. It’s also the aspect of our approach that I’m most proud of intellectually. Developing the rest of our process was mostly a matter of basic data analysis and applying existing research. But the core of our valuation system rests on a real (though modest) insight.

We’ve finally accumulated enough real-world experience with our valuation approach that I feel comfortable publicly discussing it. Now, I’m not going to give out the formula. Partly, this is to preserve some semblance of unique competitive advantage. But it’s also for practical reasons:

  • Our precise formula is tuned for our specific investment theses, which are based on our larger analysis of exit markets, technology dynamics, and diversification requirements.
  • The current version of the formula doesn’t communicate just how adaptable the fundamental concept is (and we do in fact adjust it as we learn).
  • There’s a lot of truth in the wisdom about teaching a man to fish rather than giving him a fish.

Instead, I’m going to discuss how we constructed the formula. Then you can borrow whatever aspects of our approach you think are valid (if any) and build your own version if you like.

The first part of our modest insight was to face the fact that, at the seed stage, most of the value is option value not enterprise value. Any approach based on trying to work backwards from some hypothetical future enterprise value will be either incredibly expensive or little more than a guess. But how do you measure a startup’s option value from a practical standpoint?

The second part of our modest insight was to ask, “Is there anyone who has a big stake in accurately comparing the unknown option value to some other known dollar value?”  The answer was obvious once we formulated the question: the founders. If the option value of their ownership stake were dramatically less, on a risk-adjusted basis, than what they could earn working for someone else, they probably wouldn’t be doing the startup. Essentially, we used the old economist’s trick of “revealed preference“.

We knew there could be all sorts of confounding factors. But there might be a robust relationship between founders’ fair market salaries and their valuation. So we tested the hypothesis. We looked at a bunch of then current seed-stage equity deals where we knew people on the founder or investor side, or the valuation was otherwise available. We then reviewed the founders’ LinkedIn profiles or bios to estimate their salaries.

What we found is that equity valuations for our chosen segment of the market tended to range from 2x to 4x the aggregate annual salary of the founders. The outliers seemed to be ones that either (a) had an unusual amount of “traction”, (b) came out of a premier incubator, or (c) were located in the Bay Area. Once we controlled for these factors, the 2x to 4x multiple was even more consistent.

Now, the concept of a valuation multiple is pretty common. In the public markets, equity analysts and fund managers often use the price-to-earnings ratio. For later stage startups, venture capitalists and investment bankers often use the revenue multiple. Using a multiple as a rule-of-thumb allows people to:

  • Compare different sectors, e.g., the P/E ratios in technology are higher than in retail.
  • Compare specific companies to a benchmark, e.g., company X appears undervalued.
  • Set valuations, e.g., for IPOs or acquisitions.

Obviously, 2x to 4x is a big range. The next step was to figure out what drives the variance. Here, we relied on the research nicely summarized in Sections 3.2-3.6 of Hastie and Dawes’ Rational Choice in an Uncertain World. In high-complexity, high-uncertainty environments, experts are pretty bad at making overall judgements. But they are pretty good at identifying the key variables. So if all you do is poll experts on the important variables and create a consensus checklist, you will actually outperform the experts. The explanation for this apparent paradox is that the human brain has trouble consistently combining multiple factors and ignoring irrelevant information (such as whether the investor personally likes the founders) when making abstract judgements.

So that’s what we did. We asked highly experienced angels and VCs what founder characteristics are most important at the seed stage. (We focused on the founders because we had already determined that predicting the success of ideas this early was hopeless.) The most commonly mentioned  factors fell into the general categories you’d expect: entrepreneurial experience, management experience, and technical expertise. Going to a good undergraduate or graduate program were also somewhat important. Our experts further pointed out that making initial progress on the product or the business was partly a reflection on the founders’ competence as well as the viability of the idea.

We created a checklist of points in these categories and simply scaled the valuation multiple from 2x to 4x based on the number of points. Then we tested our formula against deals that were actually in progress, predicting the valuation and comparing this prediction to the actual offer. This initial version performed pretty well. We made some enhancements to take into account location, incubator attendance, and the enterprise value of progress, then tested again. This updated version performed very well. Finally, we used our formula to actually make our own investments. The acceptance rate from founders was high and other investors seemed to think we got good deals.

Is our formula perfect?  Far from it. Is it even good? Truthfully, I don’t know. I don’t even know what “good” would mean in the abstract. Our formula certainly seems far more consistent and much faster than what other investors do at the seed stage. Moreover, it allows us to quickly evaluate deal flow sources to identify opportunities for systematically investing in reasonably valued startups. These characteristics certainly make it very useful.

I’m pretty confident other investors could use the same general process to develop their own formulas, applicable to the particular categories of startups they focus on—as long as these categories are ones where the startups haven’t achieved a clear product-market fit. Past that point, enterprise value becomes much more relevant and amenable to analysis, so I’m not sure the price-to-salary multiple would be as useful.

Even If You’re “Good”, Diversification Matters

I privately received a couple of interesting comments on my diversification post:

One of RSCM‘s angel advisors wrote, “I would think most smart people get it intellectually, but many are stuck in the mindset that they have a particular talent to pick winners.”

One of my Facebook friends commented, “VC seems to be a game of getting a reputation as a professional die thrower.”

I pretty much agree with both of these statements. However, even if you believe someone has mad skillz at die-rolling, you may still be better off backing an unskilled roller. Diversification is that powerful! To illustrate, consider another question:

Suppose I offered you a choice between the following two options:

(a) You give me $1M today and I give you somewhere between $3M and $3.67M with 99.99% certainty in 4 years.

(b) You give me $1M today and a “professional” rolls a standard six-sided die.  If it comes up a 6, I give you $20M in 4 years. Otherwise, you lose the $1M. But this guy is so good, he never rolls a 1 or 2.

The professional’s chance of rolling a 6 is 25% because of his skill at avoiding 1s and 2s. So option (b) has an expected value of $5M. Option (a) only has an expected value of $3.33M. Therefore, the professional has a 50% edge. But he still has a 75% chance of losing all your money.

I’m pretty sure that if half their wealth were on the line, even the richest players would chose (a).  Those of you who read the original post probably realize that option (a) is actually an unskilled roller making 10,000 rolls.  Therefore:

Diversifying across unskilled rolls can be more attractive than betting once on a skilled roller.

Of course, 1 roll versus 10,000 hardly seems fair.  I just wanted to establish the fact that diversification can be more attractive than skill in principle.  Now we can move on to understanding the tradeoff.

To visualize diversification versus skill, I’ve prepared two graphs (using an enhanced version of my diversification spreadsheet).  Each graph presents three scenarios: (1) an unskilled roller with a standard 1 in 6 chance of rolling a 6, (2) a somewhat skilled roller who can avoid 1s so has a 1 in 5 chance of rolling a 6, and (3) our very skilled roller who can avoid 1s and 2s so has a 1 in 4 chance of rolling a 6.

First, let’s look at how the chance of at least getting your money back varies by the number of rolls and the skill of the roller:

The way to interpret this chart is to focus on one of the horizontal gray lines representing a particular probability of winning your money back and see how fast the three curves shift right.  So at the 0.9 “confidence level”, the very skilled roller has to make 8 rolls, the somewhat skilled roller has to make 11, and the unskilled roller has to make 13.

From the perspective of getting your money back, being very skilled “saves” you about 5 rolls at the 0.9 confidence level. Furthermore, I’m quite confident that most people would strongly prefer a 97% chance of at least getting their money back with an unskilled roller making 20 rolls to the 44% chance of getting their money back with a very skilled roller making 2 rolls, even though their expected value is higher with the skilled roller.

Now let’s look at the chance of winning 2.5X your money:

The sawtooth pattern stems from the fact that each win provides a 20X quantum of payoff.  So as the number of rolls increases, it periodically reaches a threshold where you need one more win, which drops the probability down suddenly.

Let’s look at the 0.8 confidence level.  The somewhat skilled roller has a 2 to 5 roll advantage over the unskilled roller, depending on which sawtooth we pick.  The very skilled roller has a 3 roll advantage over the unskilled roller initially, then completely dominates after 12 rolls. Similarly, the very skilled roller has a 2 to 5 roll advantage over the somewhat skilled roller, dominating after about 30 rolls.

Even here, I think a lot of people would prefer the 76% chance of achieving a 2.5X return resulting from the unskilled roller making 30 rolls to the 58% chance resulting from the very skilled roller making 3 rolls.

But how does this toy model generalize to startup investing? Here’s my scorecard comparison:

  • Number of Investments. When Rob Wiltbank gathered the AIPP data set on angel investing, he reported that 121 angel investors made 1,038 investments. So the mean number of investments in an angel’s portfolio was between 8 and 9. This sample is probably skewed high due to the fact that it was mostly from angels in groups, who tend to be more active (at least before the advent of tools like AngelList).  Therefore, looking at 1 to 30 trials seems about right.
  • “Win” Probability. When I analyzed the subset of AIPP investments that appeared to be seed-stage, capital-efficient technology companies (a sample I generated using the methodology described in this post), I found that the top 5% of outcomes accounted for 57% of the payout. That’s substantially more skewed than a 1 in 6 chance of winning 20X.  My public analysis of simulated angel investment and an internal resampling analysis of AIPP investments bear this out. You want 100s of investments to achieve reasonable confidence levels. Therefore, our toy model probably underestimates the power of diversification in this context.
  • Degree of Skill. Now, you may think that there are so many inexperienced angels out there that someone could get a 50% edge. But remember that the angels who do well are the ones that will keep investing and angels who make lots of investments will be more organized. So there will be a selection effect towards experienced angels. Also, remember that we’re talking about the seed stage where the uncertainty is the highest. I’ve written before about how it’s unlikely one could have much skill here. If you don’t believe me, just read chapters 21 and 22 of Kahneman’s Thinking Fast and Slow. Seed stage investment is precisely the kind of environment where expert judgement does poorly. At best, I could believe a 20% edge, which corresponds to our somewhat skilled roller.

The conclusion I think you should draw is that even if you think you or someone you know has some skill in picking seed stage technology investments, you’re probably still better at focusing on diversification first.  Then try to figure out how to scale up the application of skill.

And be warned, just because someone has a bunch of successful angel investments, don’t be too sure he has the magic touch. According to the Center for Venture Research, there were 318,000 active angels in the US last year. If that many people rolled a die 10 times, you’d expect over 2,000 to achieve at least a 50% hit rate purely due to chance! And you can bet that those will be the people you hear about, not the 50,000 with a 0% hit rate, also purely due to chance.

Diversification Is a “Fact”

In science, there isn’t really any such thing as a “fact”.  Just different degrees of how strongly the evidence supports a theory. But diversification is about as close as we get. Closer even than evolution or gravity. In “fact”, neither evolution or gravity would work if diversification didn’t.

So I’ve been puzzled at some people’s reaction to RSCM‘s startup investing strategy.  They don’t seem to truly believe in diversification. I can’t tell if they believe it intellectually but not emotionally or rather they think there is some substantial uncertainty about whether it works.

In either case, here’s my attempt  at making the truth of diversification viscerally clear.  It starts with a question:

Suppose I offered you a choice between the following two options:

(a) You give me $1M today and I give you $3M with certainty in 4 years.

(b) You give me $1M today and we roll a standard six-sided die.  If it comes up a 6, I give you $20M in 4 years. Otherwise, you lose the $1M.

Option (b) has a slightly higher expected value of $3.33M, but an 83.33% chance of total loss. Given the literature on risk preference and loss aversion (again, I highly recommend Kahneman’s book as an introduction), I’m quite sure the vast majority of people will chose (a).  There may be some individuals, enterprises, or funds who are wealthy enough that a $1M loss doesn’t bother them.  In those cases, I would restate the offer.  Instead of $1M, use $X where $X = 50% of total wealth. Faced with an 83.33% chance of losing 50% of their wealth, even the richest player will almost certainly chose (a).

Moreover, if I took (a) off the table and offered (b) or nothing, I’m reasonably certain that almost everyone would choose nothing. There just aren’t very many people willing to risk a substantial chance of losing half their wealth. On the other hand, if I walked up to people and credibly guaranteed I’d triple their money in 4 years, almost everyone with any spare wealth would jump at the deal.

Through diversification, you can turn option (b) into option (a).

This “trick” doesn’t require fancy math.  I’ve seen people object to diversification because it relies on Modern Portfolio Theory or assumes rational actors.  Not true.  There is no fancy math and no questionable assumptions. In fact, any high school algebra student with a working knowledge of Excel can easily  demonstrate the results.

Avoiding Total Loss

Let’s start with the goal of avoiding a total loss. As Kahneman and Tversky showed, people really don’t like the prospect of losing large amounts. If you roll the die once, your chance of total loss is (5/6) = .83.  If you roll it twice, it’s (5/6)^2 = .69.  Roll it ten times, it’s (5/6)^10 = .16. The following graph shows how the chance of total loss rapidly approaches zero as the number of rolls increases.

By the time you get to 50 rolls, the chance of total loss is about 1 in 10,000.  By 100 rolls, it’s about 1 in 100,000,000.  For comparison, the chance of being struck by lightning during those same four years is approximately 1 in 200,000 (based on the NOAA’s estimate of an annual probability of 1 in 775,000).

Tripling Your Money

Avoiding a total loss is a great step, but our ultimate question is how close can you get to a guaranteed tripling of your money.  Luckily, there’s an easy way to calculate the probability of getting at least a certain number of 6s using the Binomial Theorem (which has been understood for hundreds of years).  One of many online calculator’s is here. I used the BINOMDIST function of Excel in my spreadsheet.

The next graph shows the probability of getting back at least 3x your money for different numbers of rolls.  The horizontal axis is logarithmic, with each tick representing 1/4 of a power of 10.

As you can see,  diversification can make tripling your money a near certainty. At 1,000 rolls, your probability of at least tripling up is 93%. And with that many rolls, Excel can’t even calculate the probability of getting back less than your original investment. It’s too small. At 10,000 rolls, the probability of less than tripling your money is 1 in 365,000.

So if you have the opportunity to make legitimate high-risk, high-return investments, your first question should be how to diversify. All other concerns are very secondary.

Now, I will admit that this explanation is not the last word. Our model assumes independent, identical bets with zero transaction costs. If I have time and there’s interest, I’ll address these issues in future posts. But I’m not sweeping them under the rug. I’m truly not aware of any argument that their practical effect would be significant with regards to startup investments.

Brad Feld and I Discuss Data

What do you do when you have to make decisions in an uncertain environment with only mediocre data?  Startup founders and investors face this question all the time.

I had an interesting email exchange on this topic with Brad Feld of Foundry Group. First, let me say that I like Brad and his firm.  If I were the founder of a startup for whom VC funding made sense, Foundry would be on my short list.

Now, Brad has an Master’s in Management Science from MIT and was in the PhD program. I have a Master’s in Engineering-Economic Systems from Stanford, specializing in Decision Theory.  So we both have substantial formal training in analyzing data and are both focused on investing in startups.

But we evidently take opposing sides on the question of how data should inform decision-making. Here’s a highly condensed version of our recent conversation on my latest “Seed Bubble” post (don’t worry, I got Brad’s permission to excerpt):

Brad: Do you have a detailed spreadsheet of the angel seed data or are you using aggregated data for this?… I’d be worried if you are basing your analysis… without cleaning the underlying data.

Kevin:  It’s aggregated angel data….   I’m generally skeptical of the quality of data collection in both… data sets…. But the only thing worse than using mediocre data is using no data.

Brad: I hope you don’t believe that. Seriously – if the data has selection bias or survivor bias, which this data likely does, any conclusions you draw from it will be invalid.

Kevin: …of course I believe it….  Obviously, you have to assess and take into account the data’s limitations… But there’s always some chance of learning something from a non-empty data set.  There’s precisely zero chance of learning something from nothing.

Brad: … As a result, I always apply a qualitative lens to any data (e.g. “does this fit my experience”), which I know breaks the heart of anyone who is purely quantitative (e.g.
“humans make mistakes, they let emotions cloud their analysis and judgement”).

I don’t want to focus on these particular data sets.  Suffice it to say that I’ve thought reasonably carefully about their usefulness in the context of diagnosing a seed investment bubble.  If anyone is really curious, let me know in the comments.

Rather, I want to focus on Brad’s and my positions in general. I absolutely understand Brad’s concerns.  Heck, I’m a huge fan of the “sanity check”.  And I, like most people with formal data analysis training, suffer a bit from How The Sausage Is Made Syndrome.  We’ve seen the compromises made in practice and know there’s some truth to Mark Twain’s old saw about “lies, damned lies, and statistics.” When data is collected by an industry group rather than an academic group (as is the case with the NVCA data) or an academic group doesn’t disclose the details of their methodology (as is the case with the CVR angel data), it just feeds our suspicions.

I think Brad zeroes in on our key difference in the last sentence quoted above:

…which I know breaks the heart of anyone who is purely quantitative (e.g.
“humans make mistakes, they let emotions cloud their analysis and judgement”).

I’m guessing that Brad thinks the quality of human judgement is mostly a matter of opinion or that it can be dramatically improved with talent/practice.  Actually, the general inability of humans to form accurate judgements in uncertain situations has been thoroughly established and highly refined by a large number of rigorous scientific studies, dating back to the 1950s.  It’s not quite as “proven” as gravity or evolution, but it’s getting there.

At Stanford, I mostly had to read the original papers on this topic.  Many of them are, shall we say, “difficult to digest.” But now, there are several very accessible treatments.  For a general audience, I recommend Daniel Kahneman’s Thinking Fast and Slow, where he recounts his journey exploring this area, from young researcher to Nobel Prize winner.  For a more academic approach, I recommend Hastie’s and Dawes’ Rational Choice In an Uncertain World. If you need to make decisions in uncertain environments and aren’t already familiar with the literature, I cannot recommend strongly enough reading at least one of these books.

But in the meantime, I will sum up.  Human’s are awful at forming accurate judgements in situations where there’s a lot of uncertainty and diversity (known as low validity environments).  It doesn’t matter if you’re incredibly smart.  It doesn’t matter if you’re highly experienced.  It doesn’t even matter if you know a lot about cognitive biases.  The fast, intuitive mechanisms your brain uses to reach conclusions just don’t work well in these situations. If the way quantitative data analysis works in practice gives you pause, the way your brain intuitively processes data should have you screaming in horror.

Even the most primitive and ad hoc quantitative methods  (such as checklists) generally outperform expert judgements, precisely because they disengage the intuitive judgment mechanisms. So if you actually have a systematically collected data set, even if you think it almost certainly has some issues, I say the smart money still heavily favors the data rather than the expert.

By the way, lots of studies also show that people tend to be overconfident. So thinking that you have a special ability or enough expertise so that this evidence doesn’t apply to you… is probably a cognitive illusion too. I say this as a naturally confident guy who constantly struggles to listen to the evidence rather than my gut.

My recommendation: if you’re in the startup world, by all means, have the confidence to believe you will eventually overcome all obstacles. But when you have to make an important estimate or a decision, please, please, please, sit down and calculate using whatever data is available.  Even if it’s just making a checklist of your own beliefs.

Full Year 2011 “Seed Bubble” Update

Back in April 2011, I crunched the data on seed investing dollars to show there was probably no generalized bubble. Then in November, I updated the numbers for the first half of 2011 and showed that seed investing was pretty flat.

Now that the full year 2011 angel data is out from the CVR, I have once again combined it with  the VC data from the NVCA and super angel data from EDGAR listings. (My current collation of the data is available in this Excel file) There is a healthy uptick, but it still looks much more like a recovery than a bubble.  Here are the dollar volume charts:

As you can see, angel activity is up substantially. Looking at the detailed CVR reports, seed dollar volume went from a $6.9B annual rate in 1H2011 to a $12.1B annual rate in 2H2011, for a total of $9.5B in 2011.  The fraction going to seed and early stage deals ticked up slightly from 39% to 42%.  So angel seed/early funding is still down 25% from its peak in 2005 for the year. However, 2H2011 was about the same as the peak years 2004-2006. I’d say that seed funding from angels has recovered and if it continues growing, we might see bubble territory in 2012 or 2013.

VC seed funding  dropped dramatically in 2011.  Down 47% in just one year! Average “seed” deal size was down from $4.6M to $2.3M.  I’m always hesitant to generalize from one year’s data, but it certainly looks like something might be changing for VCs.

Which brings us to the super angels. If you look at my spreadsheet, I’ve gotten a bit more structured in this analysis. Per the comments from the last edition, I now break out the planned versus actual fund sizes when looking at the SEC data.

Interestingly, Jeff Clavier’s SoftTech VC actually exceeded his planned number, hitting $55M instead of $35M. Of course, this doesn’t affect my analysis because the firm is a member of the NVCA and presumably included in their numbers. Roger Ehrenberg ‘s IA Ventures hit $98M out of an originally planned $100M and then increased the planned size to $110M. Ron Conway’s SV Angel only had $12M out of a planned $40M, but I’m pretty confident he can hit whatever number he wants. IMAF looks to only have raised $1.5M out of their planned $13M. Note that super angels are still less than 5% of the seed funding market.

Looking forward to 2012, Dave McClure’s 500 Startups is planning to raise a $50M fund and Chris Sacca’s LOWERCASE Capital is planning to raise $65M.  Healthy increases for both of them, but nothing that will fundamentally shift the industry. Individual angels and traditional angel groups are still driving total volume.

Update on the “Seed Bubble”

Earlier this year, I showed that there was little hard evidence of a general bubble in seed-stage investing.  As this recent TechCrunch article shows, the meme has persisted.   So I thought I’d take another look to see if anything has changed.

I re-crunched the CVR and NVCA data, including the new information for 1H2011 (which I annualized to make the numbers comparable).  Bottom line: there has been a slight recovery in the angel contribution and continued growth in the superangel segment.  But these increases  have been mostly offset by a decrease inVC seed activity.  (My collation of the data is available in this Excel file.) Here are updated version of the dollar volume charts.

This is about what I expected.  I think angels’ willingness to invest is driven primarily by the macro environment, which has been improving, albeit rather slowly.  I think LPs willingness to give VCs more dollars to invest is driven by both the macro environment and historical fund returns, which have been very poor.

Now I was a little surprised at the super angel situation.  I had expected a really dramatic expansion from super angels.  First, I searched for new super angels using TechCrunch, VentureBeat, and Google.  I only found two.  IMAF (focused on North Carolina) and Michael Arrington’s CrunchFund (no Web site as of this posting).  According to their SEC Form Ds, they are $13M and $16M respectively.

Second, I searched the SEC Edgar database for all the funds on the original list from Chubby Brain.  Other than Quest Venture Partners, I was able to locate filings for all the significant funds.  Jeff Clavier’s SoftTech VC and Ron Conway’s SV Angel both had decent increases, from $15M to $35M and $20M to $40M respectively.  But in my opinion, those two have reputations such that they could support much larger funds.  Equally strong were Lerer Ventures’ increase from $7M to $25M and Thrive Capital’s increase from $10M to $40M.

The big winner was Roger Ehrenberg ‘s IA Ventures with a jump from $25M to $100M!

But nobody else has appeared to raise a new fund.  Even with these increases, the total confirmed super angel dollars “only” rose from $253M to $440M.  That’s a lot, but not the $1B I would have guessed given the press coverage.  Also, a ~$200M boost spread over multiple years just isn’t that significant when you’re talking about a market that is $8.5B per year.

So I’ll stick to my guns.  No general seed bubble (at least for now).

Moneyball for Tech Startups: Kevin’s Remix

Several people have pointed me to Dan Frommer’s post on Moneyball for Tech Startups, noting that “Moneyball” is actually a pretty good summary of our approach to seed-stage investing at RSCM.  Steve Bennet, one of our advisors and investors, went so far as to kindly make this point publicly on his blog.

Regular readers already know that I’ve done a fair bit of Moneyball-type analysis using the available evidence for technology startups (see here, here, here, here, here, and here).  But I thought I’d take this opportunity to make the analogy explicit.

I’d like to start by pointing out two specific elements of Moneyball, one that relates directly to technology startups and one that relates only indirectly:

  • Don’t trust your gut feel, directly related.  There’s a quote in the movie where Beane says, “Your gut makes mistakes and makes them all the time.”  This is as true of tech startups as it is of baseball prospects.  In fact, there’s been a lot of research on gut feel (known in academic circles as “expert clinical judgement”).  I gave a fairly detailed account of the research in this post, but here’s the summary.  Expert judgement never beats a statistical model built on a substantial data set.  It rarely even beats a simple checklist, and then only in cases where the expert sees thousands of examples and gets feedback on most of the outcomes.  Even when it comes to evaluating people, gut feel just doesn’t work.  Unstructured interviews are the worst predictor of job performance.
  • Use a “player” rating algorithm, indirectly related.  In Moneyball, Beane advocates basing personnel decisions on statistical analyses of player performance.  Of course, the typical baseball player has hundreds to thousands of plate appearances, each recorded in minute detail.  A typical tech startup founder has 0-3 plate appearances, recorded at only the highest level.  Moreover, with startups, the top 10% of the startups account for about 80% of the all the returns.  I’m not a baseball stats guy, but I highly doubt the top 10% of players account for 80% of the offense in the Major Leagues.  So you’ve got much less data and much more variance with startups.  Any “player” rating system will therefore be much worse.

Despite the difficulty of constructing a founder rating algorithm, we can follow the general prescription of trying to find bargains.  Don’t invest in “pedigreed” founders, with startups in hot sectors, that have lots of “social proof”, located in the Bay Area.  Everyone wants to invest in those companies.  So, as we saw in Angel Gate, valuations in these deals go way up.  Instead, invest in a wide range of founders, in a wide range of sectors, before their startups have much social proof, across the entire US. Undoubtedly, these startups have a lower chance of succeeding. But the difference is more than made up for by lower valuations.  Therefore, achieving better returns is simply a matter of adequate diversification, as I’ve demonstrated before.

Now, to balance out the disadvantage in rating “players”, startup investors have an advantage over baseball managers.  The average return of pure seed stage angel deals is already plenty high, perhaps over 40% IRR in the US according to my calculation.  You don’t need to beat the market.  In fact, contrary to popular belief, you don’t even need to try and predict “homerun” startups.  I’ve shown you’d still crush top quartile VC returns even if you don’t get anything approaching a homerun.  Systematic base hits win the game.

But how do you pick seed stage startups?  Well, the good news from the research on gut feel is that experts are actually pretty good at identifying important variables and predicting whether they positively or negatively affect the outcome.  They just suck at combining lots of variables into an overall judgement.  So we went out and talked to angels and VCs.  Then, based on the the most commonly cited desirable characteristics, we built a simple checklist model for how to value seed-stage startups.

We’ve made the software that implements our model publicly available so anybody can try it out [Edit 3/16/2013: we took down the Web app in Jan 2013 because it wasn’t getting enough hits anymore to justify maintaining it.  We continue to use the algorithm internally as a spreadsheet app].  We’ve calibrated it against a modest number of deals.  I’ll be the first to admit that this model is currently fairly crude.  But the great thing about an explicit model is that you can systematically measure results and refine it over time.  The even better thing about an explicit model is you can automate it, so you can construct a big enough portfolio.

That’s how we’re doing Moneyball for tech startups.

The VC “Homerun” Myth

In spreading the word about RSCM, I recently encountered a question that led to some interesting findings.  A VC from a respected firm, known for its innovative approach, brought up the issue of “homeruns”.  In his experience, every successful fund had at least one monster exit.  He was concerned that RSCM would never get into those deals and therefore, have trouble generating good returns.

My initial response was that we’ll get into those deals before they are monsters.  We don’t need the reputation of a name firm because the guys we want to fund don’t have any of the proof points name firms look for.  They’ll attract the big firms some time after they take our money.  Of course, this answer is open to debate.  Maybe there is some magical personal characteristics that allows the founders of Google, Facebook, and Groupon to get top-tier interest before having proof points.

So I went and looked at the data to answer the question, “What if we don’t get any homeruns at all?”  The answer was surprising.

I started with our formal backtest, which I produced using the general procedure described in a previous post.  It used the criteria of no follow-on and stage <= 2, as well as eliminating any company in a non-technology sector or capital-intensive one such as manufacturing and biotechnology.

Now, the AIPP data does not provide the valuation of the company at exit.  However, I figured that I could apply increasingly stringent criteria to weed out any homeruns:

  1. The payout to the investor was < $5M.
  2. The payout to the investor was < $2.5M
  3. The payout to the investor was < $2.5M AND the payout multiple was < 25X.

It’s hard to imagine an investment in any big winner that wouldn’t hit at least the third threshold.  In fact, even scenarios (1) and (2) are actually pretty unfair to us because they exclude outcomes where we invest $100K for 20% of a startup, get diluted to 5-10%, and then the company has a modest $50M exit.  That’s actually our target investment!  But I wanted to be as conservative as possible.

The base case was 42% IRR and a 3.7x payout multiple.  The results for the three scenarios are:

  1. 42% IRR, 2.7x multiple
  2. 36% IRR, 2.4x multiple
  3. 29% IRR, 2.1x multiple

Holy crap!  Even if you exclude anything that could be remotely considered a homerun, you’d still get a 29% IRR!

As you can see, the multiple goes down more quickly than the IRR. Large exits take longer than small exits so when you exclude the large exits, you get lower hold times, which helps maintain IRR.  But that also means you could turn around and reinvest your profits earlier.  So IRR is what you care about from an asset class perspective.

For comparison, the top-quartile VC funds currently have 10-year returns of less than 10% IRR, according to Cambridge AssociatesSo investing in an index of non-homerun startups is better than investing in the funds that are the best at picking homeruns. (Of course, VC returns could pick up if you believe that the IPO and large acquisition market is going to finally make a comeback after 10 years.)

I’ve got to admit that the clarity of these results surprised even me.  So in the words of Adam Savage and Jamie Hyneman, “I think we’ve got to call this myth BUSTED.”

(Excel files: basecase, scenario 1, scenario 2, scenario 3)